Data analytics distinguishes itself from data analysis because it tells you what to do and what the result will be. Where data analysis gives you information about the current situation, data analytics makes predictions and tells you what the result would be by taking a certain action. In other words: data analysis focuses on the past and current situation, data analytics focuses on the future.
The case below is an example how to predict churn for recurring customers within an electricity company.
How can we make a recommendation system? How can we categorize our customers and take actions separately for each group? How can we identify objects based on specific characteristics? All these kind of questions can be answered by using data analytics techniques.
By using statistics, programming and machine learning techniques, I can find patterns hidden in the data. With this information I can make an algorithm, probability estimation or statistical model which you can use to make the right decisions.
Project duration varies between 3 weeks – 2 months. The project starts by getting an understanding of the situation and gathering the right data. After collecting the right data, I start analyzing the data and share the results. Finally, I will make the algorithm or model which you can implement in your business.
The ability to predict when a customer is at a high risk of churning is valuable for every business with returning customers. Churn is defined as the number of customers cancelling within a time period divided by the number of active customers at the start of that period. In order to apply a modeling technique to predict churn, we need to understand the customer behavior and characteristics which signal the risk of customers churn.
In this example, I will look into an electricity company. An electricity company is a good example because customers ‘return’ every month.
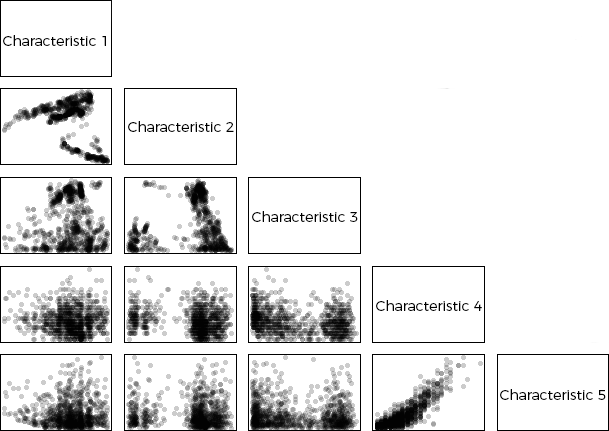
First step of the churn analysis is to select the characteristics of customers which could predict churn. Characteristics can be categorized, for example:
Customer characteristics
Behavioral characteristics
Usually, you have as many characteristics as possible (for example 50) of which you can select the ones with highest prediction power.
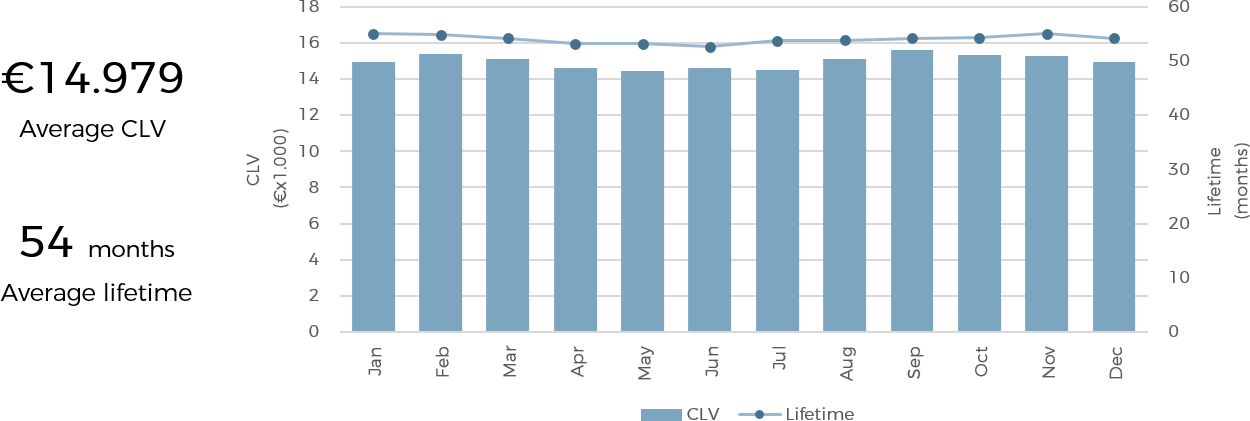
Another calculation which supports the churn prediction is to calculate the customer lifetime value (CLV or LTV). The CLV is a prediction of the total value generated by a customer in the past and in the future.
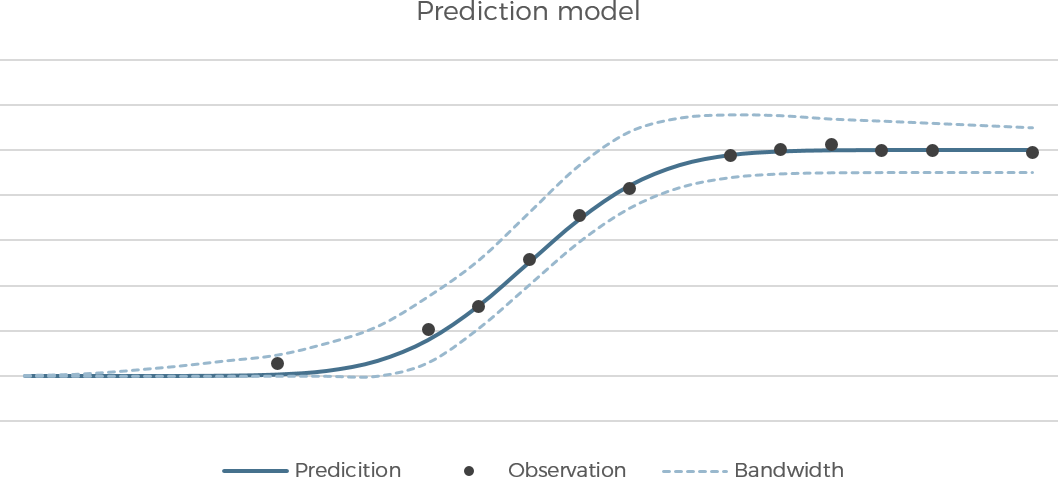
A statistical model calculates the churn probability for each customer. This model uses selected characteristics, the CLV and expected lifetime. Each element is weighted such that the accuracy of churning is maximized. After developing the model, the model is applied to all customers such that we obtain the likelihood of churning for each customer. Ranking the results gives you the top X customers who are about to churn.
Do you want to know more about data analytics? Please get in touch with me here.